
Choosing water recycling equipment in 2026 requires more than comparing catalog prices. A reliable system must match water quality, daily flow, discharge targets, available space, and operator skills. A compact food-processing plant may need different equipment than a hotel, factory, or municipal facility. The wrong choice can cause membrane fouling, unstable output, and expensive downtime. Small details matter.
This guide explores how to assess filtration, ultrafiltration, reverse osmosis, biological treatment, disinfection, and monitoring systems. It also considers energy use, chemical demand, automation, maintenance access, spare parts, and the equipment’s full operating life. Independent test results and pilot trials should support vendor claims. A polished brochure is not enough. Ask for verified recovery rates, contaminant removal data, service records, and clear warranty terms. Speak with experienced operators when possible. Their practical warnings often reveal problems hidden during demonstrations.
The Water Recycling Industry is moving toward smarter controls, lower energy consumption, and more flexible modular designs. However, newer technology is not automatically better. A sophisticated system may overwhelm a small facility with limited technical staff. A cheaper unit may create higher costs through frequent cleaning and replacement parts. This introduction frames the key decisions for selecting equipment in 2026, while recognizing an uncomfortable truth: even careful planning can miss site-specific risks. Measured results should guide the final decision.
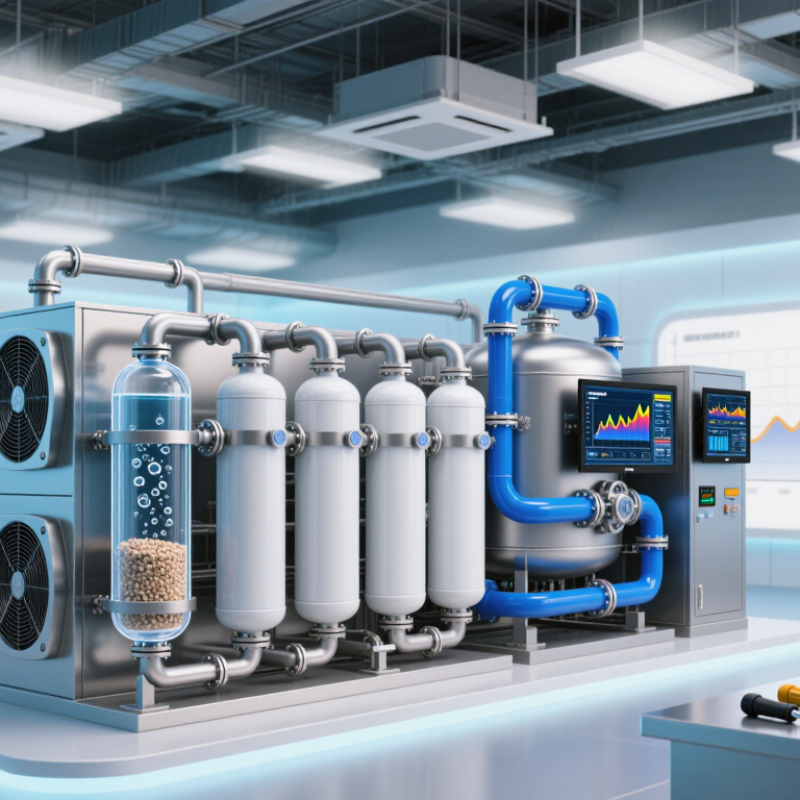
How to Choose Water Recycling Equipment in 2026?
UN-Water reports that roughly 80% of global wastewater remains untreated. That figure changes how equipment decisions should begin. Do not start with a machine catalogue. Start with measured feedwater and actual demand.
Record daily flow, peak flow, temperature, suspended solids, salinity, oils, and biological load. Collect samples during production, cleaning, and shutdown periods. One sample is not enough. Wastewater changes by the hour. A treatment system sized from an average flow may fail during a two-hour production surge.
Demand needs equal attention. Measure toilet flushing, cooling, washing, irrigation, and process-water use separately. Then estimate the required quality for each application. Cooling water may accept different conditions than equipment rinsing. Matching quality to use can reduce energy, chemical consumption, and unnecessary polishing.
Look for patterns.
In field assessments, simple flow meters and carefully dated sampling records often reveal more than a complicated forecast. Calculate recovery rate, reject volume, storage needs, and maintenance intervals before selecting filtration, biological treatment, membrane, or disinfection stages. Include alarms for turbidity, conductivity, pressure, and flow. Operators need clear readings, not hidden assumptions.
Our first demand estimate is often wrong. I have seen systems perform well technically but struggle because storage was too small. That is an uncomfortable design lesson. Leave room for seasonal changes and future expansion. Verify supplier data through pilot testing, independent laboratory results, and documented operating conditions. Reliable equipment is not merely powerful; it must remain stable when the water is inconsistent.
Quantify feedwater quality and reuse demand before selecting a treatment train.
Treatment coverage varies significantly by income group. The World Water Development Report 2017 reported approximate wastewater treatment rates of 70% in high-income countries, 38% in upper-middle-income countries, 28% in lower-middle-income countries, and 8% in low-income countries. UN-Water has also widely cited the estimate that about 80% of wastewater flows globally were discharged without treatment. These gaps highlight the need to match recycling equipment with feedwater contamination, required water quality, flow volume, and reuse demand.
Sources: UN-Water; United Nations World Water Development Report 2017, “Wastewater: The Untapped Resource.”
How to Choose Water Recycling Equipment in 2026?
Choose equipment from the end use, not from a catalogue. Define the destination. Potable supply, crop irrigation, cooling towers, and toilet flushing carry different microbial risks. WHO guidance supports health-based targets, pathogen reduction, and control of indicators such as E. coli. It also stresses multiple barriers, because one failed treatment stage can affect the entire system.
For a 2026 project, compare these targets with current national and local regulations. WHO recommendations provide technical authority, but they are not automatically legal requirements. Confirm limits for microbial indicators, turbidity, residual disinfectant, monitoring frequency, reporting, and emergency shutdowns. Regulations may vary between municipalities, even within one country. Risk changes.
Select a treatment train that can consistently meet the strictest intended use. A practical design may combine screening, biological treatment, fine filtration, membrane separation, and validated disinfection. Include online turbidity and disinfectant monitoring where required. Storage tanks also need protection from sunlight, biofilm growth, and accidental cross-connections. Keep records.
Pilot testing deserves more attention than it usually receives. Test peak flow, low flow, temperature changes, cleaning cycles, and power interruptions. A system that performs well in a laboratory may struggle with seasonal water quality. That is an uncomfortable lesson, but it matters. Ask the supplier for validation data, maintenance intervals, alarm logic, operator training, and proof of performance under realistic conditions. Recheck the design when the end use changes.
Energy figures can mislead when comparing water recycling systems. A seawater reverse osmosis (SWRO) benchmark of 3–4 kWh/m³ usually describes the desalination step, not the entire plant. Intake pumping, pretreatment, cleaning, and brine handling may increase total consumption. A practical design review should separate these loads clearly.
MF and UF membranes can remove suspended solids, bacteria, and many colloids before advanced treatment. They often need less pressure than RO, but they do not reliably remove dissolved salts. MBR combines biological treatment with membrane separation. It can produce stable reclaimed water from municipal wastewater, although aeration may dominate its energy demand. RO provides stronger salt and micropollutant removal. Its electricity use depends on feed salinity, recovery, pressure, and membrane condition.
Pilot testing matters. Measure kWh/m³, recovery, turbidity, conductivity, cleaning frequency, and concentrate volume under realistic conditions. A clean pilot skid may perform better than a dusty full-scale plant. That difference deserves attention. Operators should also check temperature changes, seasonal loading, and maintenance skills before selecting equipment. A low-energy process may become expensive if membranes foul weekly. Conversely, a higher-energy RO stage may protect sensitive reuse applications. I would avoid choosing from a single brochure value; real wastewater rarely behaves so neatly.
Choosing water recycling equipment in 2026 starts with demand, not catalog capacity. Measure daily flow, hourly peaks, and seasonal changes. A small facility may use 8,000 gallons daily, yet need 1,500 gallons within one morning hour. That peak can overload pumps, membranes, and disinfection units. Size pretreatment for the dirtiest expected influent, not the average sample. Influent quality can change after cleaning activities, storms, or production shifts.
Recovery also needs careful judgment. A system claiming 85% recovery may produce less during fouling, maintenance, or cold conditions. Allow space for reject water and cleaning chemicals. Storage should cover peak demand, equipment downtime, and several hours of operating variation. Oversized tanks increase stagnation risk. Undersized tanks force frequent freshwater use. I have seen designs that looked efficient on paper but failed during Monday morning demand.
Tips: Define the intended EPA reuse class before selecting treatment steps. EPA provides reuse frameworks, but state and local requirements may differ. Confirm limits for microbial quality, turbidity, nutrients, salinity, and monitoring frequency. Match treatment barriers to the exposure risk. Toilet flushing, irrigation, cooling, and process reuse may need different controls. Keep a simple mass-balance sheet for flow, recovery, storage, and losses. Recheck it with real operating data. That part is often neglected.
| Potential Reuse Class | Typical End Use | Average Reuse Demand | Peak-Hour Design Factor | Recommended Equipment Flow Basis | Typical Recovery Target | Storage Starting Point | Indicative Treatment Train | Key Verification Items |
|---|---|---|---|---|---|---|---|---|
| Class 1: Irrigation | Landscape irrigation, golf-course irrigation, and other non-potable outdoor uses where permitted | 10,000–100,000 gal/day (38–379 m³/day) | 1.5–2.5× average hourly demand | Size pumps and final treatment for the maximum irrigation application rate, not only the daily average. A common preliminary range is 50–500 gpm. | 70–90%, depending on influent solids, salinity, and membrane use | 1–3 days of average irrigation demand; add seasonal balancing where irrigation is intermittent | Screening or equalization → biological treatment → filtration → disinfection; add membrane treatment when salinity or stricter quality limits require it | Local irrigation rules, pathogen limits, residual disinfectant, salinity, soil permeability, runoff control, and seasonal demand |
| Class 2: Urban Non-Potable | Toilet and urinal flushing, cooling-tower makeup, street cleaning, and similar indoor or municipal uses | 5,000–75,000 gal/day (19–284 m³/day) | 2.0–3.0× average hourly demand | Use the simultaneous fixture or process demand for distribution sizing. A preliminary equipment range is 25–300 gpm. | 75–92% | 0.5–1.5 days of average demand, with separate contact volume for disinfection if required | Biological treatment → clarification or membrane bioreactor → granular or membrane filtration → UV and/or chlorination; treatment depends on the jurisdiction and end use | Cross-connection control, dual-pipe labeling, turbidity, microbial monitoring, Legionella control for cooling systems, and local plumbing requirements |
| Class 3: Industrial Process | Process washwater, boiler-feed pretreatment, rinse water, cooling-water makeup, and manufacturing utilities | 25,000–500,000 gal/day (95–1,893 m³/day) | 1.2–2.0× average hourly demand | Size each process loop independently when possible. Preliminary treatment capacity is commonly 100–2,000 gpm. | 80–95%; higher recovery may require antiscalant, softening, concentrate management, or a second-pass system | 4–24 hours of average demand; use additional buffer volume for batch processes and production shutdowns | Equalization → pH adjustment and solids removal → biological or physicochemical treatment → ultrafiltration and/or reverse osmosis → polishing as required | Process chemistry, conductivity, silica, hardness, corrosion and scaling indices, concentrate disposal, and product-contact requirements |
| Class 4: Agricultural Reuse | Restricted or unrestricted agricultural irrigation, subject to crop type, application method, and local regulation | 20,000–250,000 gal/day (76–946 m³/day) | 1.3–2.0× average hourly demand | Size for the maximum irrigation block and delivery pressure. A preliminary range is 100–1,500 gpm. | 75–90% | 1–7 days of average demand when irrigation schedules and weather create large variations | Screening → biological treatment → filtration → disinfection; add nutrient removal, salinity control, or RO when crop and soil assessments require it | Crop restrictions, pathogen reduction, nitrogen and phosphorus, electrical conductivity, sodium adsorption ratio, boron, soil drainage, and worker protection |
| Class 5: Environmental Reuse | Wetland replenishment, habitat restoration, streamflow augmentation, or other permitted environmental applications | 10,000–1,000,000 gal/day (38–3,785 m³/day) | 1.0–1.5× average flow; ecological releases may require a controlled constant rate | Size for the permitted release rate and seasonal operating window. Preliminary capacity may range from 50–4,000 gpm. | 75–95% | 1–5 days of average release demand, subject to receiving-water hydraulics and ecological requirements | Advanced biological treatment → filtration → disinfection; nutrient removal and advanced oxidation may be required for sensitive receiving environments | Receiving-water permit, nutrients, pathogens, salinity, temperature, dissolved oxygen, nutrients, trace contaminants, and ecological risk assessment |
| Class 6: Potable or Potable-Aspiring | Indirect potable reuse through an environmental buffer or reservoir; direct potable reuse may be authorized only under applicable local regulations | 50,000–5,000,000 gal/day (189–18,927 m³/day) | 1.1–1.5× average hourly demand, plus firm capacity and emergency bypass planning | Size the complete advanced treatment train for peak day and required reliability. Preliminary capacity may range from 100–20,000 gpm. | 75–90% for membrane-based advanced treatment; overall recovery depends on concentrate handling | 1–3 days of product-water demand, plus validated treatment redundancy and emergency storage as required by the regulator | Biological treatment → microfiltration or ultrafiltration → reverse osmosis → UV and advanced oxidation; stabilization and final disinfection may be required | Applicable drinking-water standards, source-control program, multiple-barrier validation, online monitoring, pathogen and chemical credits, reliability, and regulatory approval |
Choosing water recycling equipment in 2026 requires more than comparing purchase prices. Electricity can dominate operating costs, especially for membrane filtration, pumping, aeration, and ultraviolet treatment. The U.S. Department of Energy’s Water-Energy Nexus report estimates that water and wastewater services consume about 4% of U.S. electricity. That figure makes energy performance a purchasing issue, not a technical footnote.
Request a lifecycle-cost model covering energy, chemicals, labor, membrane replacement, cleaning, sludge handling, and disposal. Ask suppliers to show power use at your actual flow rate and water quality. A system treating 500 cubic meters daily may appear efficient on paper, yet high pressure can quietly inflate annual bills. The U.S. Environmental Protection Agency recommends measuring water and energy performance together, because efficiency gains in one area can create costs in another. Better recovery may also increase fouling. It is not always a win.
Field experience matters. Review maintenance logs from similar facilities, not only laboratory results. Check whether operators can access pumps, sensors, and filters without extended shutdowns. The International Energy Agency has repeatedly identified efficiency as a major source of energy savings across infrastructure sectors, but projected savings depend on real operating conditions. That part is easy to underestimate.
Build a five-to-fifteen-year cost model, test electricity-price scenarios, and include one uncomfortable assumption: performance may decline before replacement.
WhatsApp us